

The Short Answer
Every MERGE committed to a Delta table records detailed timing and file metrics in the operationMetrics map column of the table’s history. You can query these metrics with DESCRIBE HISTORY to determine not just whether a merge is slow, but where the time is being spent.
The Query
SELECT
  version,
  timestamp,
  operationMetrics['executionTimeMs'] / 1000 / 60 AS runtime_minutes,
  operationMetrics['scanTimeMs'] / 1000 / 60       AS scan_minutes,
  operationMetrics['rewriteTimeMs'] / 1000 / 60    AS rewrite_minutes,
  operationMetrics['numSourceRows']                 AS source_rows,
  operationMetrics['numTargetFilesAdded']            AS files_added,
  operationMetrics['numTargetFilesRemoved']          AS files_removed,
  operationMetrics['numTargetRowsUpdated']           AS rows_updated,
  operationMetrics['numTargetRowsInserted']          AS rows_inserted,
  operationMetrics['numTargetRowsCopied']            AS rows_copied,
  operationMetrics['numOutputRows']                  AS output_rows
FROM (DESCRIBE HISTORY your_catalog.your_schema.your_table)
WHERE operation = 'MERGE'
ORDER BY version DESC
LIMIT 50;
The Three Timing Metrics That Tell the Story
The MERGE operation exposes three timing metrics in operationMetrics that decompose where time is spent:
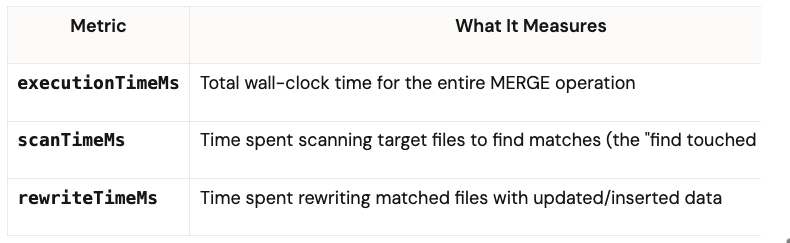
Time spent rewriting matched files with updated/inserted data
The relationship executionTimeMs ≈ scanTimeMs + rewriteTimeMs + overhead tells you which phase is the bottleneck:
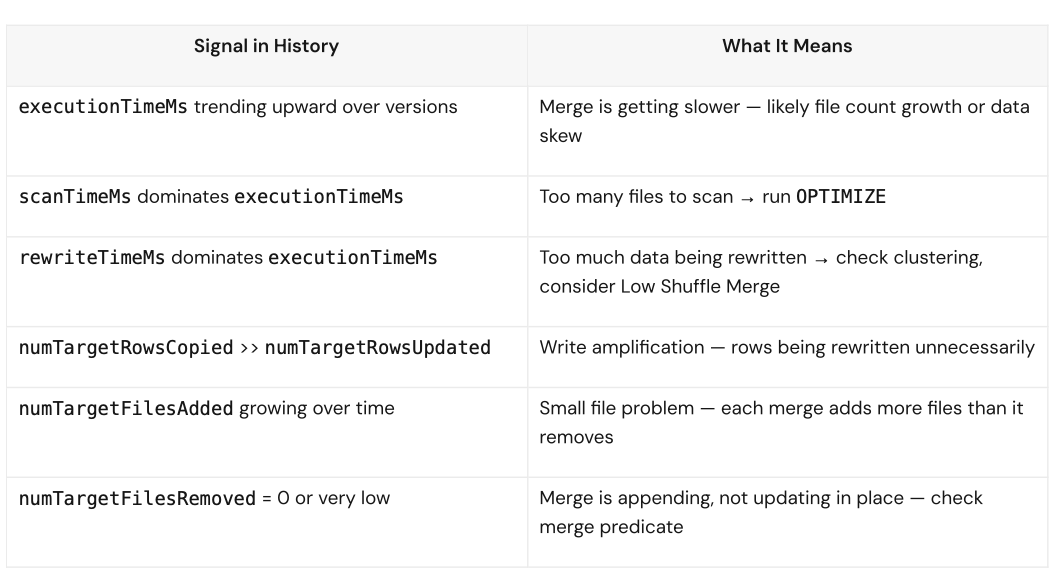
High
scanTimeMs→ The table has too many files, poor clustering, or missing data skipping. The merge is spending most of its time just finding which files to touch. This is the most common cause of slow merges.High
rewriteTimeMs→ The merge is touching/copying too many files or rows. Look atnumTargetRowsCopied— if it’s much larger thannumTargetRowsUpdated, you have excessive copy-on-write amplification.High
executionTimeMsbut low scan + rewrite → Overhead from metadata resolution, conflict detection, or commit contention.
The File Count Metrics That Confirm It
Beyond timing, the file churn metrics are equally diagnostic:
numTargetFilesAddedvsnumTargetFilesRemoved— IffilesAdded >> filesRemoved, the merge is creating many small files (a compounding problem that makes future merges slower). If both are very high, the merge is rewriting a large portion of the table.numTargetRowsCopied— Rows that were not modified but had to be rewritten because they shared a file with a modified row. A high ratio ofcopied / updatedmeans poor file layout.
Diagnostic Checklist
A Real-World Scenario
Imagine a streaming pipeline running which uses MERGE under the hood against a silver-layer table. Over time, the merge runtime creeps from 2 minutes to over an hour. Querying the history reveals:
scanTimeMsaccounts for 80% ofexecutionTimeMsnumTargetFilesAddedhas been growing steadily — the table now has millions of small filesnumTargetRowsCopiedis 100x larger thannumTargetRowsUpdated
The diagnosis: the table has a small-file problem. Each streaming merge adds files but doesn’t compact them. The scan phase has to evaluate metadata for millions of files just to find the handful that need updating. The fix: run OPTIMIZE to compact the files, and ensure Predictive Optimization or a scheduled OPTIMIZE keeps the file count healthy.
After compacting, the same history query shows scanTimeMs dropping from hours to seconds, and the merge returns to its original 2-minute runtime.
What Else Lives in the History
The full DESCRIBE HISTORY output also includes:
version— The commit version, so you can correlate with specific pipeline runstimestamp— When the commit happenedclusterId— Which cluster ran the merge (useful for comparing performance across DBR versions)engineInfo— The Spark/Photon engine versionoperationParameters— The merge predicates used
This makes it straightforward to compare good runs vs. bad runs side by side — filter by clusterId or time range and look at how the timing metrics changed.
How to Fix It: Cluster Your Table
If your history shows that scanTimeMs is the dominant cost — and it usually is — the single most impactful fix is to enable Liquid Clustering on your Delta table. Clustering physically co-locates related rows into the same files, which means the MERGE scan phase can skip the vast majority of files instead of evaluating all of them.
Choose the Right Clustering Column
The best clustering columns are the ones you merge on — typically your primary key or unique identifier. Good clustering columns have high cardinality (many distinct values), mixing low cardinality is fine as well because that gives Delta the best min/max statistics for file pruning.
Column type matters. Integers and dates make excellent clustering columns because they sort naturally and produce tight, non-overlapping min/max ranges per file. Strings work too, but integers are generally more efficient.
The UUID Problem (and UUID v7 as the Solution)
In practice, the merge key is often a UUID — and that’s where things get tricky. Traditional UUIDs (v4) are randomly generated, which means the min/max statistics Delta collects per file are nearly useless. If every file’s min UUID is 00001... and max is ffffe..., Delta can’t skip any files during the scan phase. The data skipping that makes clustering powerful simply doesn’t work.
The majority of the time, UUID is the only option for a merge key, and that’s fine — clustering on a random UUID is still better than no clustering at all, because it at least groups rows by key for the rewrite phase.
But if you have the ability to choose your identifier format, consider UUID v7. UUID v7 (defined in RFC 9562) embeds a millisecond-precision Unix timestamp in the most significant 48 bits. This means UUID v7 values are time-ordered — UUIDs generated earlier sort before UUIDs generated later. For Delta’s min/max statistics, this is transformative: each file ends up with a tight, non-overlapping range of UUIDs, and the scan phase can skip files efficiently.
If UUID v7 isn’t an option, integers (auto-incrementing IDs, sequence numbers) are the next best choice. They sort naturally and produce excellent min/max ranges.
Why Min/Max Statistics Matter
Here’s the underlying mechanism: for every data file in a Delta table, the transaction log stores min and max values for each column. When a MERGE runs, the scan phase uses these statistics to decide which files could contain matching rows and skips the rest. This is called data skipping.
Sorted/sequential values (integers, dates, UUID v7) → tight min/max ranges per file → most files skipped → fast scan
Random values (UUID v4, random strings) → wide, overlapping min/max ranges → few or no files skipped → slow scan
Clustering ensures that rows with similar key values land in the same files, which tightens the min/max ranges and makes data skipping effective. Without clustering, rows are scattered randomly across files, and every file’s min/max range spans the entire key space.
Quick Fix Checklist
Enable Liquid Clustering on your merge key column(s):
ALTER TABLE your_catalog.your_schema.your_tableCLUSTER BY (your_merge_key);Run OPTIMIZE to apply clustering to existing data:
OPTIMIZE your_catalog.your_schema.your_table;Enable Predictive Optimization so Databricks automatically runs OPTIMIZE on a schedule.
If your merge key is a UUID, evaluate whether you can switch to UUID v7 for time-ordered identifiers.
Re-run the
DESCRIBE HISTORYdiagnostic query and watchscanTimeMsdrop.
Further Reading
How to Choose Between Liquid Clustering and Partitioning with Z-Order in Delta Lake — Deep dive into when to use Liquid Clustering vs. traditional partitioning.
How Liquid Clustering Improves Streaming Merges and P99 Latency — How Liquid Clustering, deletion vectors, and row-level concurrency work together to speed up streaming merges.
Liquid Clustering at Scale: Overcoming Challenges and Unlocking Performance — Real-world lessons from migrating petabyte-scale tables to Liquid Clustering.
Databricks Documentation: Table History Schema and Operation Metrics — Official reference for all
operationMetricskeys by operation type.RFC 9562: UUID v7 Specification — The standard defining time-ordered UUIDs.
Summary
DESCRIBE HISTORY + filtering on operation = 'MERGE' + extracting executionTimeMs, scanTimeMs, and rewriteTimeMs from the operationMetrics map is the definitive way to tell if a merge is slow and why. No external monitoring tools needed — the evidence is right there in the Delta transaction log.
And when you find the problem, the fix is almost always the same: cluster your table on the merge key, choose sortable column types when possible, and keep the table compacted with OPTIMIZE.
FAQ
Q: What’s the fastest way to check if a Delta MERGE is slow? A: Run DESCRIBE HISTORY on the table, filter for operation = 'MERGE', and pull executionTimeMs, scanTimeMs, and rewriteTimeMs from the operationMetrics map (casting the string values to numbers). If scanTimeMs dominates executionTimeMs, your merge has a file-scanning problem.
Q: Why is scanTimeMs often the biggest contributor to slow merges? A: In scan-dominated workloads it’s typically caused by too many small files, poor clustering, or missing data skipping, which forces the merge to evaluate far more files than necessary just to find matching rows.
Q: Does clustering on a random UUID help at all? A: Yes, somewhat. It won’t improve scan-phase data skipping much because random UUIDs produce wide, overlapping min/max ranges, but it still groups rows by key for the rewrite phase, which helps reduce copy-on-write amplification.
Q: Why is UUID v7 better than UUID v4 for Delta MERGE performance? A: UUID v7 embeds a millisecond-precision timestamp, making values time-ordered. This produces tight, non-overlapping min/max ranges per file, which allows Delta’s data-skipping logic to work effectively during the scan phase.
Q: Is Liquid Clustering a one-time fix, or does it need maintenance? A: Enabling clustering isn’t enough on its own — you still need to run OPTIMIZE (or enable Predictive Optimization) regularly to apply clustering to new data and keep file counts healthy over time.
Q: Can I use this same DESCRIBE HISTORY approach for other operations besides MERGE? A: Yes. operationMetrics is populated for other operation types too (such as UPDATE, DELETE, and OPTIMIZE), though the specific metric keys available differ by operation, and keys may be absent — returning NULL — for some commits or runtime versions.
Isn't clustering mostly done on low cardinality fields?